
Multi-Agent Orchestration: From One Agent to Many (and When Not To)

You start with one coding assistant and it’s great. So you add a second agent to review the first. Then a planner. Then a tester. Each addition feels reasonable, and somewhere around the fourth one the system starts to wobble: the logs balloon, the agents make contradictory decisions, costs spike, and you’re back babysitting it at 2 a.m. wondering whether all this orchestration actually bought you anything.

That tension — more power versus more pain — produced one of 2025’s sharpest engineering disagreements. On June 12, Cognition (the team behind Devin) published “Don’t Build Multi-Agents,” arguing that parallel subagents make independent decisions on shared problems and produce conflicting, fragile output. Less than 24 hours later, Anthropic published “How we built our multi-agent research system,” reporting a multi-agent architecture that outperformed a single agent by 90.2% on their research evaluation. Two of the most respected teams in the field, opposite conclusions, same week.

Here’s the thing: they’re both right. Resolving that apparent contradiction is the key to using multi-agent systems well — and it starts by recognising what these systems actually are.

Multi-agent orchestration is distributed systems

The most useful reframe in this whole topic: you are not inventing something new. A team of agents passing messages, delegating work, and sharing state is a distributed system, and the patterns have names that predate LLMs by decades — orchestrator-worker, pipeline, message bus, blackboard, the actor model. The failure modes are the classic distributed-systems failure modes too: race conditions, cascading failures, coordination overhead, partial failure.

Separation of concerns, single responsibility, clear interfaces, idempotency, error handling, observability, bounded resources — everything you already know about building reliable systems still applies, and applies harder, because you’ve added a new source of nondeterminism on top. The teams that fail with multi-agent treat it as a vibe. The teams that succeed treat it as an engineering problem with known patterns and known failure modes. As one widely-shared 2026 benchmark put it bluntly: the gap between a good agent system and a bad one is almost never the framework — it’s the eval pipeline, the observability, and the failure-recovery logic.

When multi-agent actually helps

Anthropic and Cognition don’t actually disagree on the principle; they were describing different workloads. Anthropic’s own write-up is explicit about the boundary. Multi-agent systems earn their keep when a task has:

  • Heavy parallelism — it splits into independent strands that don’t need to talk to each other.
  • Information that exceeds a single context window — more material than one agent can hold, so you spread it across several windows.
  • Many complex tools to coordinate.
  • High enough value to justify the cost — and the cost is real: their multi-agent system used roughly 15× the tokens of a single chat.

And they’re equally explicit about when it doesn’t fit — which, notably, includes most coding:

“Most coding tasks involve fewer truly parallelisable tasks than research, and LLM agents are not yet great at coordinating and delegating to other agents in real time.”

That’s the resolution of the debate. Research parallelises beautifully — five subagents investigate five subtopics in isolation and report back. Coding often doesn’t, because changes are tightly interdependent: the function you’re writing depends on the type the other agent just changed. Cognition’s point is that splitting tightly-coupled work across agents fragments the context each one needs, and they make conflicting decisions. Anthropic’s point is that splitting loosely-coupled work across agents is a superpower. Both true.
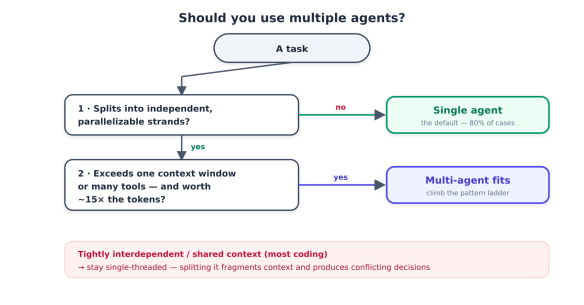
Flowchart illustrating when to use multiple agents for tasks, detailing conditions for single and multi-agent usage.

The default is still one agent

Before any pattern, internalise the most important rule: start with a single, well-prompted agent with good tools. It handles something like 80% of what people reach for frameworks to solve. Multi-agent is the exception you reach for when a single agent hits a hard wall — a context-window limit, a genuinely parallel workload, a tool-coordination problem — not the default architecture. This is the same instinct as “start with the monolith”: don’t pay distributed-systems complexity until a real constraint forces you to.

The pattern ladder

When you do go multi-agent, you’re choosing a topology, and there’s a clear ladder from simplest to most complex. Each rung adds capability and cost, and each has a characteristic failure mode worth knowing before you climb.
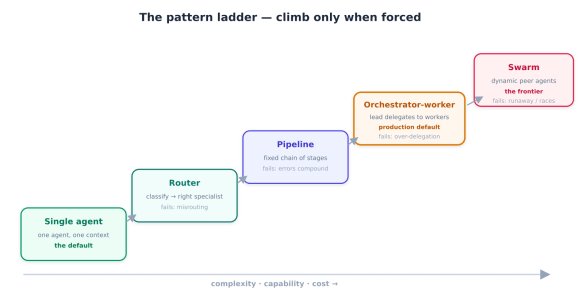
A diagram illustrating the 'pattern ladder' with various stages including Single Agent, Router, Pipeline, Orchestrator-worker, and Swarm. Each stage describes its characteristics, complexity, capabilities, and potential failures, emphasising the progression and relationships between different patterns.
  • Single agent — one agent, one context window, a good toolset. The baseline and the right answer most of the time.
  • Router — a lightweight classifier inspects each request and sends it to the right specialist agent. Still single-agent execution; you’ve just picked which one. Cheap and reliable. Failure mode: misrouting.
  • Pipeline (sequential) — agents in a fixed chain, each transforming the previous one’s output: writer → editor → fact-checker. Deterministic and easy to reason about. Failure mode: errors compound down the chain.
  • Orchestrator-worker (supervisor) — a lead agent decomposes a task and delegates sub-tasks to specialised workers, then synthesises their results. This is what production looks like in 2026, with the widest framework support (Claude Agent SDK, LangGraph, OpenAI Agents SDK, CrewAI’s hierarchical process). Failure mode: over-delegation — the orchestrator spawning workers endlessly — which you bound with iteration ceilings.
  • Swarm — a dynamic, open-ended population of peer agents that coordinate through shared memory or a message bus rather than a fixed coordinator. The frontier, powerful for massively parallel work. Failure modes: runaway spawning and shared-state race conditions, which you bound with population caps and concurrency safeguards.

Start at the bottom and climb only when forced. Most teams that succeed land on orchestrator-worker; most teams that fail jumped to a swarm because it sounded impressive.

A preview of the failure surface

One sobering data point to carry forward: a Berkeley research team catalogued 14 distinct failure modes specific to multi-agent LLM systems — things like agents losing track of who’s responsible for what, conversations derailing, and one agent’s error propagating through the whole team. These sit on top of every normal software failure mode, not instead of them. Multi-agent doesn’t replace your reliability engineering; it demands more of it. That’s the subject we keep returning to.

Building a Team of Coding Agents

We’ve just hit an uncomfortable truth: most coding isn’t parallelisable, so a team of coding agents is the exception, not the rule. This part is about finding the exceptions — the coding work that genuinely benefits from multiple agents — and building it correctly with the orchestrator-worker pattern.

First, find the parallel work

Before writing any orchestration code, do the analysis that most teams skip: figure out which parts of your task are actually independent. Coding work falls into two buckets, and only one belongs in a multi-agent system.

Tightly coupled (keep single-threaded): A refactor where every change depends on the last. Implementing a feature whose pieces share evolving types and assumptions. Anything where worker B needs to know what worker A just decided. Splitting this across agents fragments the context each needs and produces the conflicting decisions Cognition warned about. Use one agent.

Loosely coupled (parallelise): Work that decomposes into independent strands sharing little context:

  • Broad, read-only exploration. “Find every call site of this deprecated API across the monorepo.” “How do these eight modules each handle caching?” Each strand is independent and mostly read-only — the ideal multi-agent workload, exactly like Anthropic’s research case.
  • Independent implementation units. Three unrelated bug fixes in three unrelated modules. A set of similar-but-separate endpoints. Each can be a worker on its own branch.
  • The role split. Author, tester, reviewer, and security as separate agents with separate contexts — not parallel on the same code, but a pipeline of specialised perspectives.

The discipline here is just good old task decomposition. If you can’t write down sub-tasks that are genuinely independent, you don’t have a multi-agent problem — you have a single-agent task you’re overcomplicating.

The decision that makes or breaks it: the isolation boundary

Once you have independent sub-tasks, the single most important design decision is the isolation boundary: what does each worker need to know about what the others are doing? Anthropic’s answer for research was radical and worth copying: almost nothing. Each subagent gets a self-contained task description, an expected output format, and a fresh context window. It doesn’t know the other workers exist and can’t coordinate with them mid-task.

That isolation is not a limitation — it’s the whole point. It’s what lets workers run in true parallel, and it’s what keeps the orchestrator’s context window from drowning in cross-talk. In software terms, you’re enforcing single responsibility (each worker owns one job) and a clean interface (the task description is the worker’s API contract; its structured result is the return value). The workers are pure functions with respect to each other.

Diagram illustrating the Orchestrator-worker model for coding, showing the Orchestrator leading and delegating tasks to Workers A, B, and C, each with isolated environments and scoped tools.

For coding, isolation has a concrete, beautiful implementation: one git worktree per worker. Each agent gets its own checked-out branch in its own directory, so parallel workers physically cannot collide on the filesystem, and merging back is an ordinary pull request. Isolation boundary and execution isolation become the same mechanism.

Building the orchestrator

Here’s the shape of an orchestrator-worker system for coding. It’s deliberately framework-agnostic — the pattern matters more than the library, and you can map it onto LangGraph, CrewAI, or the Claude/OpenAI SDKs (more on that below).

from dataclasses import dataclass

@dataclass
class SubTask:
id: str
description: str # the worker's entire contract — self-contained
output_schema: dict # the expected structured result

# ---- ORCHESTRATOR ---------------------------------------------------------
def orchestrate(task: str, max_workers: int = 6) -> str:
plan = decompose(task) # lead agent: split into sub-tasks
if len(plan) <= 1:
return single_agent(task) # not parallel — don't multi-agent it
plan = plan[:max_workers] # bound fan-out (over-delegation guard)

results = run_parallel(spawn_worker, plan) # workers run isolated, in parallel
return synthesize(task, results) # lead agent merges the findings

def decompose(task: str) -> list[SubTask]:
"""Lead agent returns ONLY independent sub-tasks. If it can't, return one."""
system = ("Split this task into INDEPENDENT sub-tasks that share no state and "
"can run in parallel. Each must be self-contained. If the work is "
"tightly coupled, return a single task. Output JSON only.")
return [SubTask(**t) for t in call_model(system, task)["subtasks"]]

# ---- WORKER ---------------------------------------------------------------
def spawn_worker(sub: SubTask) -> dict:
"""A worker: fresh context, isolated worktree, self-contained brief."""
wt = make_worktree() # its own branch + directory
agent = Agent( # fresh context window
system=f"You are a focused coding agent. Task:\n{sub.description}\n"
f"Return a result matching this schema: {sub.output_schema}",
tools=scoped_tools(wt), # least privilege, confined to worktree
)
return bounded(agent.run, max_iterations=25) # cap iterations — no runaway loops

Read what’s not in there: no worker-to-worker channel, no shared mutable state, no unbounded loops. Every choice is a software fundamental:

  • decompose returns one task when the work is coupled — the system refuses to multi-agent a single-agent problem. This one guard prevents most multi-agent disasters.
  • max_workers and max_iterations bound resources — the direct fix for the over-delegation failure mode.
  • output_schema makes each worker’s result a typed contract the orchestrator can rely on, not free text it has to re-parse.
  • scoped_tools(wt) gives each worker least-privilege access confined to its worktree — containment, exactly as a single agentic worker needs.

Synthesis is where quality is won or lost

The orchestrator’s hardest job isn’t delegating — it’s synthesising. Workers return partial, independently-derived results; the lead agent has to reconcile them into one coherent answer, catch contradictions, and decide what to keep. This is the step Cognition was worried about: independent workers can reach incompatible conclusions. The mitigation is to keep synthesis single-threaded and authoritative — one orchestrator with the full picture decides, rather than letting workers negotiate. For coding specifically, synthesis often ends not in merged code but in N pull requests the orchestrator opens for human review — keeping a person at the merge boundary.

Mapping to frameworks

You can hand-roll the above, but in production most teams use a framework. The pattern maps cleanly onto all of them; pick by your needs, not hype:

  • LangGraph — models the orchestrator as a graph with conditional edges and durable execution, so a long-running team survives a server restart, with checkpointing and the most mature tracing (LangSmith). The production default for complex flows; steeper learning curve.
  • CrewAI — role-based “crews” with a hierarchical process; fastest to prototype (a team in ~20 lines), lighter on production observability.
  • OpenAI Agents SDK — explicit handoffs that pass context between agents; clean and opinionated, but model-locked and light on checkpointing.
  • Claude Agent SDK — subagents with tool-use chains, wired to data and tools via MCP.

But heed the consensus from every serious 2026 comparison: the framework is the least consequential choice. What determines whether your team survives its first production incident is the eval pipeline, the observability, and the failure-recovery logic.

Keeping the fundamentals intact

Notice that nothing in this build is novel computer science. It’s classic engineering applied to a new substrate:

  • Single responsibility → one job per worker.
  • Interface/contract → the self-contained task description and output schema.
  • Statelessness / isolation → fresh context window + dedicated worktree per worker.
  • Bounded resources → caps on workers and iterations.
  • Least privilege → tools scoped to each worker’s worktree.
  • A single authoritative integrator → the orchestrator owns synthesis; workers don’t negotiate.

Get those right and orchestrator-worker is robust. Skip them and you get the wobble.

Swarms, Coordination & Keeping It Production-Safe

Orchestrator-worker has a fixed coordinator and a bounded set of workers. The top rung of the ladder removes both constraints — and that’s exactly why it’s powerful and dangerous in equal measure.

Swarms: the frontier, and its sharp edges

A swarm dynamically spawns an open-ended population of peer agents based on workload, and they coordinate through shared memory or a message bus rather than through a central orchestrator. There’s no single agent holding the whole plan; coordination is emergent. This is the frontier of multi-agent design, and it shines for massively parallel, open-ended work where you can’t predict up front how many workers you’ll need or how they should divide labour.

It’s also where the distributed-systems bill comes due in full. Remove the fixed coordinator and you inherit every hard problem in concurrent computing:

  • Runaway spawning. A peer agent decides it needs help and spawns more agents, which spawn more — an unbounded fork bomb made of LLM calls, each one expensive. The fix is a hard population cap enforced outside the agents’ control.
  • Shared-state race conditions. Multiple agents reading and writing the same memory concurrently produce exactly the corruption you’d expect from any unsynchronised concurrent system. You need the classic safeguards: locks, atomic operations, or append-only logs with conflict resolution.
  • Nondeterminism and emergence. With no central plan, behaviour emerges from interactions and is hard to reproduce or debug. Two identical runs can diverge.
Diagram illustrating a swarm system with peer agents and emergent coordination, featuring a shared memory/message bus with no fixed coordinator, and indicating a population cap.

The honest guidance: most teams should not build a swarm. If orchestrator-worker can express your problem — and it usually can — use it. Reach for a swarm only when the workload is genuinely open-ended and massively parallel, and only with the safeguards above wired in from the start. A swarm without a population cap is not an architecture; it’s an outage waiting for a trigger.

Coordination and shared state

Whether you’re running a careful swarm or a more dynamic orchestrator-worker variant, the moment agents share state you’ve re-entered concurrent-systems territory. Two classic patterns cover most needs:

  • The blackboard. Agents read from and write to a shared “blackboard” of state. Simple, but every write is a potential race; guard it like any shared resource.
  • The message bus / actor model. Agents are actors that communicate only by passing messages — no shared mutable state at all. This is what AutoGen’s v0.4 rewrite adopted (an event-driven actor core), and it’s the more robust choice precisely because it sidesteps shared-memory races by design. If you’re building coordination from scratch, prefer message-passing over shared memory for the same reason you would in any concurrent system.

And recall Cognition’s core warning, which applies most sharply here: agents making independent decisions on a shared problem produce conflicting outputs, and the fragility compounds. The mitigation is to keep the parts that need shared context single-threaded, and only parallelise the parts that are genuinely independent. Coordination you can avoid is coordination you can’t get wrong.

The failure surface you’re signing up for

A Berkeley research team catalogued 14 distinct failure modes unique to multi-agent LLM systems — among them agents losing track of responsibilities, derailing into unproductive loops, one agent’s hallucination propagating through the team, and premature termination where the system stops believing it’s done before it is. The critical point for production: these are additional to every failure mode your software already has. Multi-agent doesn’t simplify your reliability engineering — it multiplies what you must account for. Which is why the rest of this part is about scaffolding, not agents.

Keeping the software fundamentals intact

Whatever pattern you land on — pipeline, supervisor, or swarm — the disciplines that keep it production-safe are the same disciplines that keep any distributed system reliable. The framework debate is a distraction; this scaffolding is the actual work, and it’s where the gap between a system that survives its first incident and one that doesn’t really lives.

Diagram illustrating key concepts of classic reliability engineering related to a multi-agent core, featuring elements such as Observability & tracing, Durable execution, Evals, and Bounded resources on one side and Structured contracts, Least privilege, and Human checkpoints on the other.
  • Observability and tracing. You cannot debug what you cannot see, and a multi-agent run is a distributed trace across many context windows. Capture every agent, every delegation, every tool call, every hand-off — this is what mature tooling (LangSmith and peers) exists to provide. Without it, a misbehaving fleet is a black box.
  • Durable execution and checkpointing. Agent runs are long; servers restart. Checkpoint state so a team can resume rather than restart from zero — a headline reason LangGraph leads in production. This is just write-ahead logging and crash recovery, applied to agents.
  • Evals — the real differentiator. Every serious practitioner converges on the same point: the eval pipeline matters more than the framework. You need a suite that measures whether the whole system produces good outcomes, because in multi-agent systems “minor changes cascade into large behavioural changes” — a one-line prompt tweak can reshape the whole team’s behaviour. Without evals you’re flying blind through a non-linear system.
  • Bounded resources. Iteration ceilings (against over-delegation), population caps (against runaway spawning), and token budgets (against the 15× cost blowing up silently). Every loop and every spawn needs a bound enforced outside the agent’s judgement.
  • Structured contracts between agents. Typed task descriptions in, structured results out — so a hand-off is a checked interface, not a hopeful paragraph. The same reason you type your function signatures.
  • Least privilege. Each agent gets only the tools, data, and credentials its job requires. One compromised or confused agent in a fleet shouldn’t be able to touch production — and at fleet scale, this is non-negotiable.
  • Human checkpoints. For anything consequential — merging code, spending money, touching customers — a human sits at the boundary. Autonomy scales the work; human checkpoints scale the trust.

None of these is AI-specific. They’re the reliability practices distributed systems have always needed. Multi-agent orchestration doesn’t let you skip them — it raises the price of skipping them.

The whole picture

The shape is clear. Start with one good agent. Climb to multiple agents only when a real constraint — parallelism, context limits, tool coordination, justified by value — forces you up the ladder. Prefer the simplest pattern that works: router, then pipeline, then orchestrator-worker, and only rarely a swarm. Isolate workers aggressively so they don’t have to coordinate. Keep the parts that need shared context single-threaded. And wrap the whole thing in the ordinary scaffolding of reliable software — observability, durable execution, evals, bounded resources, contracts, least privilege, human checkpoints.

The promise of agent swarms is real: for the right workload, a team of agents does things no single agent can. But the teams that realise that promise aren’t the ones with the most agents or the trendiest framework. They’re the ones who remembered that an agent fleet is a distributed system, and that we already know how to build those well. The intelligence is new. The engineering is not — and the engineering is what keeps it standing.

Eyes Everywhere: Secure Logging and Alerting for Modern Systems – Part III


Logging and alerting become truly powerful only when they are embedded into a well-designed security architecture. Individual applications emitting logs or isolated detection rules provide only partial visibility. Modern organisations operate distributed systems composed of microservices, cloud infrastructure, container platforms, and external APIs. In such environments, security visibility requires a unified architecture capable of collecting, analysing, and responding to telemetry across the entire system.


Designing Systems That Detect and Respond to Threats

A secure observability architecture combines several layers. Applications generate structured logs. Infrastructure produces telemetry about hosts, containers, and network activity. These signals are collected and aggregated through centralized pipelines, analyzed by security analytics platforms, and ultimately transformed into alerts and automated responses.

Application Layer Logging

Application logs represent the most detailed source of telemetry because they capture business logic events. These events include authentication attempts, financial transactions, configuration changes, and access to sensitive resources.

Applications should emit structured logs that can be easily parsed by downstream analytics systems. A simple implementation using Python might produce JSON-formatted events.

import json
import logging
from datetime import datetime

logger = logging.getLogger("app")

def log_user_action(user_id, action, resource):

event = {
"timestamp": datetime.utcnow().isoformat(),
"event_type": "user_action",
"user_id": user_id,
"action": action,
"resource": resource,
"service": "account-service"
}

logger.info(json.dumps(event))

Such structured events allow centralized systems to search and correlate activity across multiple services. A user accessing a resource through an API gateway, for example, may generate logs in multiple backend services. A consistent schema allows analysts to reconstruct the entire request path.

Application logs also provide the richest context for security detection because they capture events at the business logic level rather than merely technical operations.

Infrastructure Telemetry

While application logs capture internal logic, infrastructure telemetry reveals the behavior of the underlying environment. Systems must monitor operating systems, network activity, and runtime platforms to detect suspicious behavior that occurs outside the application layer.

Operating systems produce authentication logs, process execution records, and network activity events. On a Linux system, failed SSH login attempts may appear in the authentication log.

Failed password for invalid user root from 203.0.113.11 port 42122 ssh2

Infrastructure monitoring agents collect these events and forward them to centralized logging systems.

A simple agent configuration might stream logs to a central collector.

filebeat.inputs:
- type: log
paths:
- /var/log/auth.log

output.elasticsearch:
hosts: ["https://log-server.example.com:9200"]

Network telemetry is also crucial. Firewall and network gateway logs reveal scanning attempts, suspicious connections, and unusual traffic flows.

An example network connection event might appear as structured telemetry.

{
"event_type": "network_connection",
"source_ip": "198.51.100.44",
"destination_port": 22,
"protocol": "TCP",
"timestamp": "2026-06-01T13:42:18Z"
}

Combining application and infrastructure telemetry provides comprehensive security visibility.

Aggregation Layer

Large systems generate logs from thousands of sources. Without aggregation, these logs remain scattered across machines and services.

The aggregation layer collects logs from applications, infrastructure components, and network devices. Log collectors such as Fluent Bit, Logstash, or Vector ingest telemetry and forward it to centralized platforms.

A typical log collection configuration might look like the following Fluent Bit pipeline.

fluent-bit \
-i tail \
-p path=/var/log/app.log \
-o http \
-p host=logging.example.com \
-p port=8080

Collectors normalize log formats and enrich events with metadata such as host identifiers, container IDs, or geographic location. This enrichment improves searchability and correlation across systems.

Aggregation pipelines also buffer logs during network disruptions to ensure no data is lost.

Analysis Layer

Once collected, logs must be analyzed to detect suspicious behavior. This is the role of the analysis layer.

Security analytics platforms ingest aggregated telemetry and apply detection rules, statistical models, and anomaly detection algorithms.

A SIEM platform might evaluate login activity using a query such as the following.

SELECT username, COUNT(*) AS failures
FROM logs
WHERE event_type = 'authentication_failure'
AND timestamp > NOW() - INTERVAL '10 minutes'
GROUP BY username
HAVING COUNT(*) > 20

If this query produces results, the platform triggers an alert.

More advanced analytics engines also perform behavioral analysis. These systems learn typical usage patterns and detect deviations.

An anomaly detection algorithm implemented in Python might evaluate whether a user’s activity deviates significantly from historical behavior.

def detect_anomaly(current_activity, baseline):
threshold = baseline * 5
if current_activity > threshold:
return True
return False

These analytic processes convert massive volumes of telemetry into actionable intelligence.

Response Layer

Detection alone is insufficient. Systems must also respond to threats.

The response layer integrates alerting systems with operational tools such as incident management platforms, messaging systems, and automated security controls.

When an alert is triggered, the system may send notifications to security teams.

def send_alert(message):
alert = {
"alert_type": "security_event",
"message": message,
"timestamp": datetime.utcnow().isoformat()
}
notify_security_team(alert)

Automated responses may also be triggered for critical threats. For example, a brute-force attack might result in immediate blocking of the source IP address.

def block_ip(ip_address):
firewall.block(ip_address)

These automated defenses reduce response time and limit the impact of attacks.

Securing the Logging Pipeline

Protecting Log Transport

Log data often travels across networks before reaching centralized systems. If this communication is not secured, attackers could intercept or manipulate logs.

Secure logging pipelines encrypt log transport using TLS.

A log collector configuration may enforce encrypted transport.

output:
elasticsearch:
hosts: ["https://logs.example.com:9200"]
ssl.certificate_authorities: ["/etc/certs/ca.pem"]

TLS ensures confidentiality and prevents unauthorized interception of telemetry.

Mutual authentication can also verify that only trusted systems send logs to the platform.

Preventing Log Tampering

Attackers frequently attempt to erase or modify logs to hide evidence of their activity.

To protect against this, logging systems implement append-only storage and integrity verification.

One approach uses cryptographic hashing to chain log entries together.

import hashlib

def generate_log_hash(entry, previous_hash):
combined = entry + previous_hash
return hashlib.sha256(combined.encode()).hexdigest()

Each log entry includes the hash of the previous entry. If an attacker modifies an entry, the hash chain becomes invalid, revealing the tampering.

Write-once storage systems further protect logs by preventing modification after ingestion.

Isolation of Logging Infrastructure

Security telemetry must be isolated from application environments. If attackers gain access to the same infrastructure that stores logs, they may attempt to manipulate or delete evidence.

Organizations often deploy logging infrastructure in dedicated environments accessible only to security teams.

A simplified architecture may route logs from production systems to a separate security network.

app_server -> log_collector -> security_logging_cluster

Strict access control policies ensure that application administrators cannot modify stored logs.

Isolation ensures the integrity of forensic data during incident investigations.

Cloud-Native Logging and Alerting

Observability in Microservices Architectures

Microservices architectures introduce new challenges for observability. A single user request may traverse dozens of services before completing.

Distributed tracing provides visibility into these interactions by assigning correlation identifiers to requests.

A service might attach a request ID to every log entry.

const requestId = generateRequestId();

logger.info({
request_id: requestId,
event: "api_request_received"
});

Downstream services propagate this identifier so analysts can trace the entire execution path.

Kubernetes and Container Logs

Container orchestration platforms generate extensive telemetry about container lifecycles, pod scheduling, and cluster activity.

Kubernetes exposes logs through its API.

kubectl logs deployment/payment-service

Security-relevant cluster events may include pod creation, container crashes, and unexpected resource modifications.

A cluster event might look like the following.

{
"event_type": "pod_created",
"namespace": "production",
"pod_name": "api-server-6f45",
"timestamp": "2026-06-01T14:22:33Z"
}

Monitoring these events allows organizations to detect suspicious deployments or unauthorized configuration changes.

Serverless Logging Challenges

Serverless environments introduce additional complexity because execution environments are ephemeral. Functions may run for only a few milliseconds before terminating.

As a result, logs must be exported immediately to centralized systems.

A serverless function might log activity using a cloud-native logging service.

import logging

def handler(event, context):
logging.info({
"event_type": "function_execution",
"function": "payment_handler",
"timestamp": context.timestamp
})

Centralized logging ensures that transient environments do not lose telemetry.

Automation and AI in Security Monitoring

Automated Detection Pipelines

Security monitoring increasingly relies on automated detection pipelines capable of processing large volumes of telemetry in real time.

Machine learning models can identify patterns that traditional rule-based systems might miss.

A simple anomaly detection model might analyze login frequency.

from sklearn.ensemble import IsolationForest

model = IsolationForest()
model.fit(training_data)
prediction = model.predict(new_login_data)
if prediction == -1:
trigger_alert("Login anomaly detected")

Such models can detect subtle deviations in user behavior.

AI-Assisted Threat Analysis

Artificial intelligence systems can assist analysts by prioritizing alerts and correlating events across large datasets.

An AI system might analyze multiple signals simultaneously.

if unusual_login and new_device and large_data_access:
alert("Possible account compromise")

By correlating signals across logs, AI systems can identify complex attack patterns.

Automated Response

Automation can also mitigate attacks automatically.

For example, if a system detects repeated authentication failures from a specific IP address, it may block that address.

if failed_attempts > 50:
firewall.block(source_ip)

If suspicious activity occurs on a user account, automated controls may disable the account temporarily.

def disable_account(user_id):
account_service.disable(user_id)

Automation reduces the time between detection and response, limiting the damage attackers can cause.

Logging and Alerting Best Practices Checklist

Principles for Secure Observability

Effective observability systems focus on collecting meaningful telemetry, protecting the integrity of logs, and designing alerts that enable rapid response.

Applications should log security-relevant events using structured formats. Infrastructure telemetry must complement application logs to provide full visibility into system behavior. Detection rules must evolve continuously as new threats emerge.

Security monitoring is not a static system but an evolving process.

Continuous Improvement

Attackers constantly change tactics, techniques, and procedures. Security monitoring systems must therefore evolve continuously.

Detection rules should be refined based on real-world incidents and emerging threat intelligence.

Security teams often review historical incidents and update detection logic accordingly.

def update_detection_rules(new_patterns):
rules_engine.add(new_patterns)

This iterative improvement ensures that monitoring systems remain effective against modern threats.

Observability as a Security Strategy

Modern software systems produce enormous volumes of telemetry. Yet data alone does not provide protection. Security emerges only when organizations design observability systems that transform telemetry into actionable intelligence.

Secure logging provides the foundation. Alerting transforms logs into early warning signals. Automated responses limit the impact of attacks.

When implemented correctly, logging and alerting systems become the digital equivalent of surveillance infrastructure, continuously monitoring the environment for suspicious activity.

In an era where attackers move rapidly and stealthily, secure observability gives defenders the visibility required to detect threats early, investigate incidents effectively, and protect critical systems before damage occurs.

Eyes Everywhere: Secure Logging and Alerting for Modern Systems – Part II


Logging is the foundation of security visibility, but logs alone do not defend systems. A modern production environment may generate millions or even billions of log entries per day. Hidden within this massive stream of telemetry are the signals that reveal active attacks, compromised accounts, and data exfiltration attempts.

Without intelligent processing, these signals remain buried inside an ocean of noise.

Alerting transforms raw logs into actionable intelligence. It is the mechanism through which suspicious events are detected, prioritized, and escalated to the people or systems capable of responding.

In a mature security architecture, logging produces the raw telemetry, while alerting converts that telemetry into security awareness.


From Logs to Security Intelligence

Modern software systems produce enormous quantities of telemetry. A single API gateway may process tens of thousands of requests per second, while a Kubernetes cluster might generate hundreds of infrastructure events every minute. Each of these activities produces logs.

A simplified example of application logging may look like the following Python implementation.

import logging
import json
from datetime import datetime

logging.basicConfig(level=logging.INFO)

def log_api_request(user_id, endpoint, ip):
event = {
"event_type": "api_request",
"user_id": user_id,
"endpoint": endpoint,
"source_ip": ip,
"timestamp": datetime.utcnow().isoformat()
}

logging.info(json.dumps(event))

This code produces useful telemetry, but by itself it does not provide any defense capability. The system will continue logging events even if an attacker performs malicious actions.

To detect attacks, systems must interpret patterns in logs.

For example, a single failed login attempt is normal. Hundreds of failed login attempts from the same IP address within seconds indicate a brute-force attack.

A detection rule might analyze logs to identify such behavior.

def detect_bruteforce_attempt(log_events):

failed_attempts = {}

for event in log_events:
if event["event_type"] == "authentication_failure":
ip = event["source_ip"]
failed_attempts[ip] = failed_attempts.get(ip, 0) + 1

if failed_attempts[ip] > 10:
print(f"ALERT: Possible brute force attack from {ip}")

In practice, such analysis occurs inside centralized analytics platforms rather than application code. The example illustrates how raw telemetry becomes security intelligence only when interpreted.

Detection Engineering

Detection engineering is the discipline of designing rules and analytics that transform logs into security detections.

A detection rule describes a pattern that indicates suspicious activity.

Consider a typical credential stuffing scenario where attackers attempt to log into many accounts using stolen credentials.

A detection rule may look like the following example expressed in pseudo-SIEM query language.

SELECT source_ip, COUNT(*) AS failures
FROM authentication_logs
WHERE event_type = 'authentication_failure'
AND timestamp > NOW() - INTERVAL '5 minutes'
GROUP BY source_ip
HAVING COUNT(*) > 50

If the query returns results, it means a single IP address generated more than fifty authentication failures within five minutes. This pattern strongly suggests automated attack activity.

Detection engineering often involves continuous refinement. As attackers change tactics, detection rules must evolve to identify new patterns.

Another example might detect privilege escalation events.

SELECT user_id, COUNT(*) AS role_changes
FROM audit_logs
WHERE event_type = 'role_assignment'
AND timestamp > NOW() - INTERVAL '10 minutes'
GROUP BY user_id
HAVING COUNT(*) > 5

Multiple role changes within a short time window may indicate suspicious administrative activity.

These rules convert raw telemetry into detectable threats.

Security Analytics Platforms

Manual log analysis quickly becomes impossible in modern environments. Organizations therefore rely on specialized security analytics platforms to process telemetry.

Security Information and Event Management systems, commonly known as SIEM platforms, collect logs from multiple systems and apply detection logic.

Logs might be shipped to such a platform using log collectors.

fluent-bit -i tail -p path=/var/log/app.log -o http://siem.example.com/ingest

Once ingested, the SIEM platform normalizes logs and runs detection rules.

An example event inside such a system might look like the following JSON structure.

{
"event_type": "authentication_failure",
"username": "alice",
"source_ip": "198.51.100.44",
"service": "login-api",
"timestamp": "2026-05-12T14:18:22Z"
}

Behavioral analytics tools can also detect anomalies. Instead of relying only on fixed rules, they analyze historical patterns and identify deviations.

For example, a system might detect that a user account suddenly accesses resources from a different country.

if user_country != last_known_country:
generate_alert("Geographic anomaly detected")

These analytics systems convert telemetry into meaningful signals that security teams can investigate.

Designing Effective Security Alerts

Not all alerts are useful. Poorly designed alerts generate noise rather than insight.

A meaningful alert must provide enough information for responders to understand the event.

A minimal alert message might include context such as the affected user, IP address, and event type.

{
"alert_type": "brute_force_attack",
"source_ip": "203.0.113.10",
"failed_attempts": 120,
"time_window": "5 minutes",
"timestamp": "2026-05-12T15:01:22Z"
}

Such an alert provides investigators with the context required to understand the threat quickly.

Alerts must also avoid excessive false positives. If every minor anomaly generates a notification, responders quickly learn to ignore them.

Alert Severity Levels

Security alerts typically fall into several severity levels depending on their impact and urgency.

An informational event may indicate activity worth recording but not immediate action.

A suspicious event suggests unusual behavior requiring investigation.

A critical alert indicates a likely security incident that demands immediate response.

An example alert structure might encode severity explicitly.

{
"severity": "high",
"alert": "privilege_escalation_detected",
"user": "admin_17",
"action": "granted_admin_role",
"target_user": "user_448",
"timestamp": "2026-05-12T16:20:11Z"
}

Severity classification allows security systems to prioritize responses.

Mapping Alerts to Attack Scenarios

Effective alerting requires understanding how attacks unfold.

Credential stuffing attacks generate many login failures.

if failed_attempts > 100:
alert("Credential stuffing attack suspected")

Privilege escalation attempts involve changes to user roles.

if event["event_type"] == "role_assignment" and event["role"] == "admin":
alert("Administrative privilege granted")

Data exfiltration often involves unusually large data transfers.

if download_size > 100000000:
alert("Large data export detected")

By mapping alerts to real-world attack behaviors, systems detect threats earlier in the attack lifecycle.

Reducing Alert Fatigue

Alert fatigue is one of the most significant challenges in security monitoring.

When systems generate excessive alerts, security teams become overwhelmed. Investigators cannot review every alert, and critical events may be missed.

Consider an example where every failed login triggers an alert.

if event["event_type"] == "authentication_failure":
alert("Login failure detected")

Such a rule would generate thousands of alerts per day in a busy system.

Effective alerting must filter noise and focus on patterns.

Tuning Detection Rules

Detection rules often rely on thresholds.

For example, a system might trigger an alert only after repeated failures.

if failed_login_count > 10:
alert("Multiple failed login attempts detected")

These thresholds must be tuned carefully based on real system behavior.

Too low and alerts become noisy. Too high and attacks may go unnoticed.

Behavioral and Anomaly Detection

Static thresholds are not always sufficient. Behavioral detection analyzes historical data to understand what normal activity looks like.

If a user typically downloads a few megabytes of data per day but suddenly exports gigabytes of data, the system may flag this behavior.

if current_download > (average_download * 10):
alert("Unusual data access pattern detected")

Behavioral analysis allows systems to detect sophisticated attacks that evade simple rules.

Correlation of Multiple Signals

Sophisticated attacks often produce multiple weak signals rather than one obvious indicator.

Correlation combines these signals to detect complex threats.

For example, consider the following sequence:

  1. Multiple failed login attempts
  2. Successful login from new IP address
  3. Administrative privilege change

Individually, each event might seem harmless. Together, they suggest account compromise.

A correlation rule might analyze events across multiple logs.

if failed_logins > 20 and new_ip_login and privilege_change:
alert("Potential account takeover detected")

Correlation significantly improves detection accuracy.

Real-Time vs Delayed Alerting

Certain threats require instant response.

A brute-force attack against authentication endpoints may require immediate blocking of the source IP.

if failed_login_attempts > 100:
block_ip(source_ip)

Unauthorized administrative actions may also require real-time intervention.

if event["event_type"] == "admin_role_granted":
alert("Unauthorized administrative privilege assignment")

Immediate alerts are designed to stop attacks before damage occurs.

Investigative Alerts

Some alerts are better suited for investigation rather than immediate response.

For example, unusual access patterns might require analysis before action is taken.

if login_country != last_known_country:
alert("User login from new geographic region")

Such alerts inform analysts who then evaluate the context.

Incident Response Integration

Alerting systems often integrate with incident response platforms.

When an alert triggers, it may automatically create a ticket.

def create_incident(alert):
ticket = {
"title": alert["alert_type"],
"severity": alert["severity"],
"timestamp": alert["timestamp"]
}
send_to_incident_system(ticket)

Security orchestration tools may also automate responses.

if alert["severity"] == "critical":
disable_user_account(alert["user"])

These integrations accelerate response times.

Building an Effective Alerting Workflow

Alert routing ensures that notifications reach the appropriate teams.

Operational alerts may go to infrastructure teams, while security alerts go to security operations.

A routing rule might look like the following configuration.

alerts:
- type: security
route: security_team
- type: infrastructure
route: ops_team

Routing prevents unnecessary interruptions and ensures that specialists receive relevant alerts.

Escalation Paths

Some alerts require escalation if not addressed quickly.

An alert may first notify an on-call engineer. If unresolved after a defined period, it escalates to a broader response team.

if alert_not_acknowledged(minutes=10):
escalate_to_security_manager(alert)

Escalation policies ensure that serious incidents receive attention.

Incident Triage and Investigation

Once an alert is received, investigators must determine whether the alert represents a genuine threat.

Triage typically involves examining related logs.

def investigate_alert(alert_id):
related_events = query_logs(alert_id)
return analyze(related_events)

Investigators look for supporting evidence such as additional suspicious activity or known attack indicators.

If the alert is confirmed as a security incident, incident response procedures begin.

At this stage, logs become crucial again, allowing investigators to reconstruct the timeline of the attack.


Alerting transforms passive logging systems into active defense mechanisms. When detection rules are carefully engineered, alerts become the early warning system that reveals threats before attackers achieve their objectives.